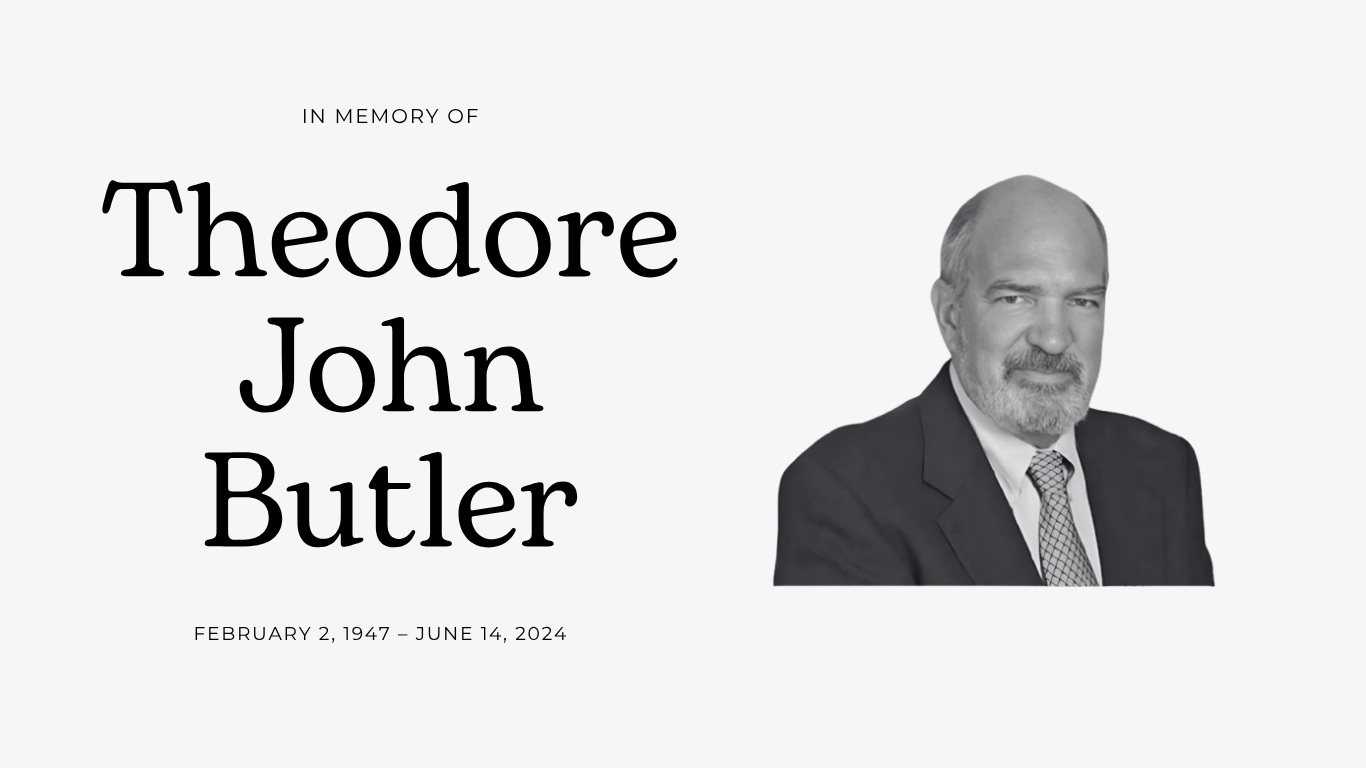
Gold and silver prices continued to rally from what now looks like important price lows at the end of third quarter, some six weeks ago. This week, gold ended up by $48 (2.6%), while silver tacked on $1.16 (4.8%). As a result of silver’s relative outperformance, the silver/gold price ratio tightened in by a point and a half, to 73.5 to 1. This is close to the most fully-valued silver has been relative to gold in about 4 months.

This week’s price gains put gold at its highest level in 5 months, while silver is at highs not seen in 3.5 months. Gold is well-above all three of its key moving averages, while silver is well-above 2 of its 3 key moving averages, and closed just a few pennies below its 200-day moving average. The last time silver upwardly penetrated all three of its key moving averages was back in April, so it’s not an everyday occurrence. Again, moving averages mean little to me, except as it affects the behavior of many in the technical community. Talk and sentiment of important price breakouts have become commonplace.

With no new Commitments of Traders (COT) report published yesterday, due to the Veteran’s Day holiday, I plan on separate comments on the report late Monday, as is my custom. Surely there have been significant positioning changes, both through the Tuesday cutoff and in trading since then. I’ll include some special comments today on what feels to be a developing physical tightness in silver after running through the usual weekly format.

The turnover or physical movement of metal either brought into or removed from the COMEX-approved silver warehouses cooled notably this week as just under 2.1 million oz were moved, the lowest weekly total since January. Total COMEX silver inventories fell by 1.1 million oz to 352.8 million oz, while holdings in the JPMorgan COMEX fell by 0.2 million oz to 179.3 million oz.

There was some slight movement in the COMEX gold warehouses this week, but the total remained unchanged at 33.1 million oz, with a very slight decline in the JPMorgan COMEX gold warehouse to 12.56 million oz. Nothing much to see here.

Physical holdings in the world’s gold ETFs continued to fall slightly, despite the strengthening gold price, with total holdings down less than 100,000 oz for the week.  As has been the pattern for some time, holdings in the silver ETFs rose by nearly 4 million oz, largely as a result of yesterday’s deposit of that amount into SLV, with more silver also flowing into the PSLV. My sense is that more physical silver is “owed” to the SLV and it wouldn’t surprise me if the short position in SLV has grown, but we won’t know that until the next short report, late in the day on Nov 24 for positions held as of the close of business on Monday, Nov 15.

While I must hold off on reporting the actual positioning changes until Monday’s release of the COT report, I do admit that the price action in gold and silver “feels” a bit different in that while there have been significant positioning changes on the COMEX, I sense the creeping influence of physical tightness developing, particularly in silver. That doesn’t mean the commercial shorts will not try to rig prices lower and may succeed in doing so, but if the growing physical demand for silver gets to a critical point (as I believe may be occurring), then the newly added silver shorts could blow up in the commercials’ face.

While there has been significant short covering by the big commercial silver shorts over most of this year, I sense they have resorted to new shorting to contain this rally. If that turns out to be the case, then I must defer to the premise held by my departed friend and mentor, Izzy Friedman, who remained convinced that the big silver shorts would get caught with their full pants down and overwhelmed by the reality that physical always trumps paper when the going gets critical. More on this in a moment.

I continue to be surprised that the US Mint refuses to produce Silver Eagles as proscribed by law and soon I supposed the Mint will announce it has to prepare for the new year by ceasing production for this year. Again, the most plausible explanation for the Mint’s refusal to produce Silver Eagles is that it doesn’t want to contribute to the current physical tightness in silver.


A Silver Re-Run of 2010-2011?


The funny thing about history is that while it is being made, it’s quite difficult to know how it will be judged later. Only with the passage of time does the true meaning and significance of events become clear. The history of silver is no exception and what we may have thought at the time of significant unfolding events only becomes clearer with the benefit of hindsight.

It has now been more than 10 years that have passed by since the historic run-up in silver prices to near $50 (for the second time) into the end of April 2011. The decade that followed the historic run-up has not been particularly kind to silver investors, certainly not compared to the decade preceding that great price rise. Operating under the belief that in order to see the future, it’s wise to review the past, I’d like to share some thoughts on what led to the run-up in silver prices in 2011.

First things first; as a card-carrying member (and originator) of the COMEX short syndicate manipulation of silver (and gold) prices and as deep as anyone into the inner workings of the COMEX paper market structure, according to COT report data, let me state that, unequivocally, the price run-up in 2011 had little or near nothing to do with COMEX paper positioning. Let me repeat that – the run-up to near $50 in 2011 had nothing to do with COMEX paper trading. Instead, the run-up ten years ago was due to the only possible alternative – physical market tightness.

As far as providing proof that significant changes in paper positioning on the COMEX wasn’t the driver of price, the data are available on the CFTC’s web site. Starting with the COT report of Sep 7, 2010, when the price of silver was at $19.50, total open interest in COMEX silver futures was 139,500 contracts and the concentrated short position of the 4 largest traders was 51,200 contracts and the managed money net long position was 44,500 contracts. Seven months later, on April 26, 2011, the price of silver was $49, total open interest was 143,000 contracts and the concentrated short position of the 4 largest traders was 36,000 contracts and the managed money net long position was down to 23,000 contracts. By way of simple explanation, the managed money traders decided, quite subjectively, that silver was over-priced when it got to the mid to high $20’s and too high risk to hold.

The concentrated short position of the 4 largest shorts fell by 15,000 contracts and the managed money net long position fell by more than 21,000 contracts. While this is at odds with the near-constant experience that the commercials never buy on the upside, the amounts – roughly 2000 contracts per month for 7 months can hardly be considered the key driving force for the $30 or more than 150% price gain. Certainly, the sale of more than 21,000 managed money net long contracts over this same time eliminates completely any idea that speculative buying on the COMEX drove silver prices higher (as so many continue to believe to this day).

So, if it wasn’t speculative buying or even aggressive commercial short covering that drove silver prices to near $50 in 2011, then what was it? By the process of elimination, but also including the careful examination of what did take place over the seven months to that price peak, the most compelling feature of that time was the surge of 70 million oz of physical silver that came to be bought and deposited into the big silver ETF, SLV. In addition, during this time, the Sprott silver ETF, PSLV, was introduced, creating demand for 20 million additional silver ounces.

With the passage of time and the perspective that brings, it is clear that what caused the run-up in silver prices to near $50 over 7 months into the end of April 2011 was the buying of 90 million oz in SLV and PSLV and not speculative buying on the COMEX. I would also add that there was nothing at all unusual with any surge in actual deliveries against COMEX futures contracts over this time, which I mention because so many believe it will be a “squeeze” in COMEX deliveries that will cause silver prices to soar. While that may turn out to be the case in the future, it certainly wasn’t a factor in 2011.

One point to be remembered in the silver run-up in 2011 was that it was almost exclusively a silver and not gold affair. While silver ran up by $30 or by 150% in 7 months, gold rose by $300 or 25% over that same time. Plus, there was no developing physical shortage or notable ETF buying in gold. That said, gold did not collapse in price starting in May 2011 and moved to new highs over $1900 later that year. My point here is to emphasize that the run-up into April 2011 was almost exclusively a silver affair and not part of any wider financial market situation.

In concluding that net collective investment buying in SLV was the main driver of price, accompanied by the 70 million oz of physical silver buying that resulted from the buying of the shares, that is further confirmed by the resultant net collective investment selling in SLV and the redemption of 60 million ounces that occurred over less than two months following the price break starting on May 1 of that year. Buying in SLV drive the price higher, followed by selling in SLV which drove the price of silver lower. Trading on the COMEX significantly greased the skids for lower prices starting May 1, 2011, but the great run-up and subsequent fall was mainly an SLV affair.

By way of review, it was the great run-up due to physical silver buying in SLV and PSLV into April 2011 that first alerted JPMorgan, the biggest silver short at the time, of the inevitability of a physical silver shortage and was the genesis for its criminally-brilliant solution of accumulating physical silver (and gold). The 60 million oz that was redeemed in the SLV in May and June of 2011 was the first big chunk of physical silver acquired by JPM (on its way to 1.2 billion oz).

So, why am I strolling down the memory lane of 2011? Because there are signs that history may be about to repeat itself. Specifically, if it was physical silver buying and the resultant physical tightness that was behind the great run-up in 2011, as the evidence makes clear, then the signs of physical tightness today may be signaling a re-run of that event – only this time on steroids. Certainly, we have the tightest retail silver market in history, with the highest premiums and longest delivery times. And compared to 2011, as I described on Wednesday, more of the world’s inventory of 1000 oz bars are tied up in the world’s silver ETFs and in the COMEX warehouses than ever before – 1.6 billion oz or 80% of all the silver bullion in the world.

The biggest differences between now and 2011 are primarily related to JPMorgan’s position then and now. Back then, JPM had just come to learn the real story in silver and began to accumulate as much physical silver as it could, first strictly as a defensive measure to protect itself and its dominant and controlling role as the largest short seller on the COMEX. Never one to let a money-making opportunity not go fully-exploited, JPMorgan decided to keep accumulating physical silver well after it had fully-hedged its short position on the COMEX, turning what was a defensive maneuver into the largest physical silver position in history. Along the way, JPM ditched its COMEX short position completely and put to rest any regulatory concerns with the Justice Dept. and the CFTC with a slap on the wrist settlement in 2019. It took JPMorgan a full decade to pull this off, but pull it off it did.

Therefore, the single biggest difference between the run-up in silver prices in 2011 and any prospective future run-up is, first and foremost, the role of JPMorgan. No longer short and holding 1.2 billion oz of physical silver, JPM’s position today couldn’t be more opposite to its position in April 2011, when it was still the biggest COMEX short and holding no physical. Talk about a difference as profound as night and day. With that in mind, let’s review other big differences.

Today, the short position of the largest COMEX shorts is likely greater (we await new COT data) than it was in April 2011, but without the backing of the most powerful financial entity in the world, JPM. And entities close to JPMorgan now hold the largest share of the physical silver bullion that exists. This puts those short silver in a more precarious position than could be imagined. But it doesn’t stop there.

Over the past 10 years, there have been, to put it mildly, the greatest changes in the history of the financial world. Led by the US and China, but also including virtually every country in the world, the supply of money and with it, total investment buying power, have grown exponentially by the greatest amounts ever. World stock and real estate prices have soared beyond belief, growing in valuation by the hundreds of trillions of dollars. A whole new asset class, cryptocurrencies have grown from nothing to be worth $3 trillion. Record amounts of debt have been created that have been funneled into a pool of world investment buying power (and risk) few would have contemplated ten years ago.

Not only is there more investment buying power driving the price of nearly everything to new highs, there is now an overall speculative mindset gripping the world, where just about everyone is on the prowl for the quickest and biggest gains possible – which is reflected in the greatest amount of leverage and option buying thought impossible not many years ago. Individual stocks (to say nothing of new crypto’s) can double or triple in a day due to options and other leveraged vehicles. The idea of a “meme” stock didn’t exist a year or so ago, now a new one seems to crop up daily.

Now take what you see all around you (even if you try not to look) – the unbridled creation of money and investment buying power, coupled with a speculative mindset greater than ever existed – and superimpose that onto the developing physical silver shortage. Talk about setting a match to a swimming pool filled with gasoline. And I would remind you that the infrastructure for leveraged buying already exists in the silver ETFs, with particular mention that options trading on SLV has been in existence for 15 years.

With the passage of time, I’m further convinced that those that caused the silver run-up in 2011 included many who did not even realize that buying shares of SLV resulted in physical silver being bought and deposited by the sellers. You see, it didn’t matter if the buyers of silver ETFs knew or cared that physical metal must be deposited as new shares were created. Investors bought silver ETFs because the price was rising – same as it ever was. As and when silver prices rise enough in the future, it is reasonable to conclude that collective investor behavior will remain as it has over history, namely, higher prices will generate more buying – and that buying in the silver ETFs will require that physical silver be deposited.

While financial buying power has grown exponentially, any increase in the amount of physical silver in existence has grown slightly, if at all. The ownership of the world’s supply of physical silver has changed greatly, with those associated with JPMorgan coming to hold the lion’s share, but that just makes the mismatch between what could be demanded and what could be supplied that much greater. No one can tell you the exact timetable in advance, but when this train gets rolling for real, it’s near impossible to see how it could be derailed before reaching some historic price destination. In such circumstances, it would seem best to be already onboard instead of trying to hop a runaway train.

The rally in gold and silver prices this week, increased the 8 largest gold and silver COMEX shorts’ total losses by more than $1.4 billion to $11.4 billion. That’s up more than $3 billion from the end of the third quarter (Sep 30) and is the largest total loss since the $14 billion total loss at yearend 2020. Contrast that loss to what I would calculate are JPMorgan & associates open profits of $28 billion and remember that back at the price bottom of March 2020, both the 8 big shorts and JPMorgan were, essentially, even.

I have to wait until the new COT report to know for sure if he or she has stuck around (as I suspect), but the new gold whale in COMEX futures is now ahead by $100 on what I estimate is a 38,000-contract position (3.8 million oz) or a cool $380 million on a position established only two or three months ago. Remarkably, I haven’t run across any independent confirmation (or rebuttal) of the gold whale’s existence.

As a reminder, I do plan on publishing comments on the new COT report after it is released Monday, likely before or around 6:00 PM EST. I’d much prefer sleeping on the report overnight, as I invariably miss something in the instant analysis – but whatever I miss, I should catch by Wednesday’s article.

Ted Butler

November 13, 2021

Silver – $25.40      (200 day ma – $25.44, 50 day ma – $23.49, 100 day ma – $24.21)

Gold – $1868         (200 day ma – $1792, 50 day ma – $1785, 100 day ma – $1790)

Comments are closed.